
RETECHNOLOGY PREMIUM MARKETPLACE RELATED PRODUCTS | WEBINARS | SPECIAL OFFERS


You are viewing our site as an Agent, Switch Your View:
Agent | Broker Reset Filters to Default Back to ListRealtor.com October Housing Report: Number of Homes for Sale Surpasses 2020 Levels
November 03 2022
In October, the national inventory of active listings grew 33.5% year-over-year to a two-year high; affordability challenges continued to drive home shopper interest in relocating in Q3
SANTA CLARA, Calif., Nov. 3, 2022 -- The U.S. supply of for-sale homes hit a milestone on the road to recovery from the shortage of the past two years in October, as active listings soared 33.5% year-over-year to the highest level since 2020, according to the Realtor.com® Monthly Housing Trends Report released today. However, October data suggests that fewer home shoppers could afford to take advantage of the rise in available inventory, with time on market continuing to climb amid still-high listing prices.
"As the rapid runup in rates reshapes housing market dynamics this fall, both buyers and sellers are taking a step back to recalibrate their plans. Home shoppers are looking at a monthly mortgage payment that is roughly $1,000 higher than at this time last year, and incomes are rising but not by that much. Combined with asking prices that are still climbing at a double-digit yearly pace, the average American has taken a huge hit to their homebuying power," said Danielle Hale, Chief Economist for Realtor.com®. "Still, our data indicates that some aspiring homeowners are finding ways to make the most of inventory conditions, such as by exploring relatively affordable metros. For buyers with the flexibility, relocating to a lower-priced market could help offset higher mortgage costs. There's also a takeaway for sellers in these areas – on a well-priced home, you could still see strong interest from these out-of-towners."
October 2022 Housing Metrics – National
Inventory recovery accelerates amid higher rates and moderating demand
In October, the U.S. supply of active listings grew at a record-fast annual pace and surpassed 2020 levels for the first time, even as new sellers declined year-over-year for the fifth consecutive month. Additionally, pending listings, or homes under contract with a buyer, continued to drop. These trends indicate that October's accelerated inventory improvements were largely due to moderating buyer demand, fueled by mortgage costs that are rising at a faster pace than inflation and incomes. While some softening in seller participation is typical in the fall, this year's significant new listings declines reflect the impact of home shoppers' diminished buying power on seller sentiment. However, sellers may still see strong buyer competition for fewer options in some regions, with inventory still lagging October 2020 levels in the Northeast and Midwest, regions where home sales declines have also been more modest.
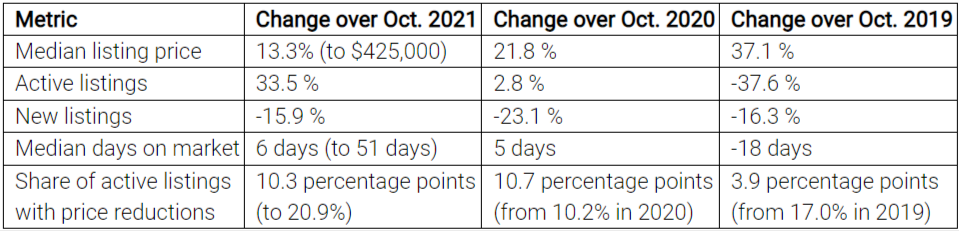
- Nationally, active inventory grew 33.5% year-over-year in October, reaching the highest level in 24 months. Meanwhile, both newly-listed homes (-15.9%) and pending listings (-30.0%) declined year-over-year.
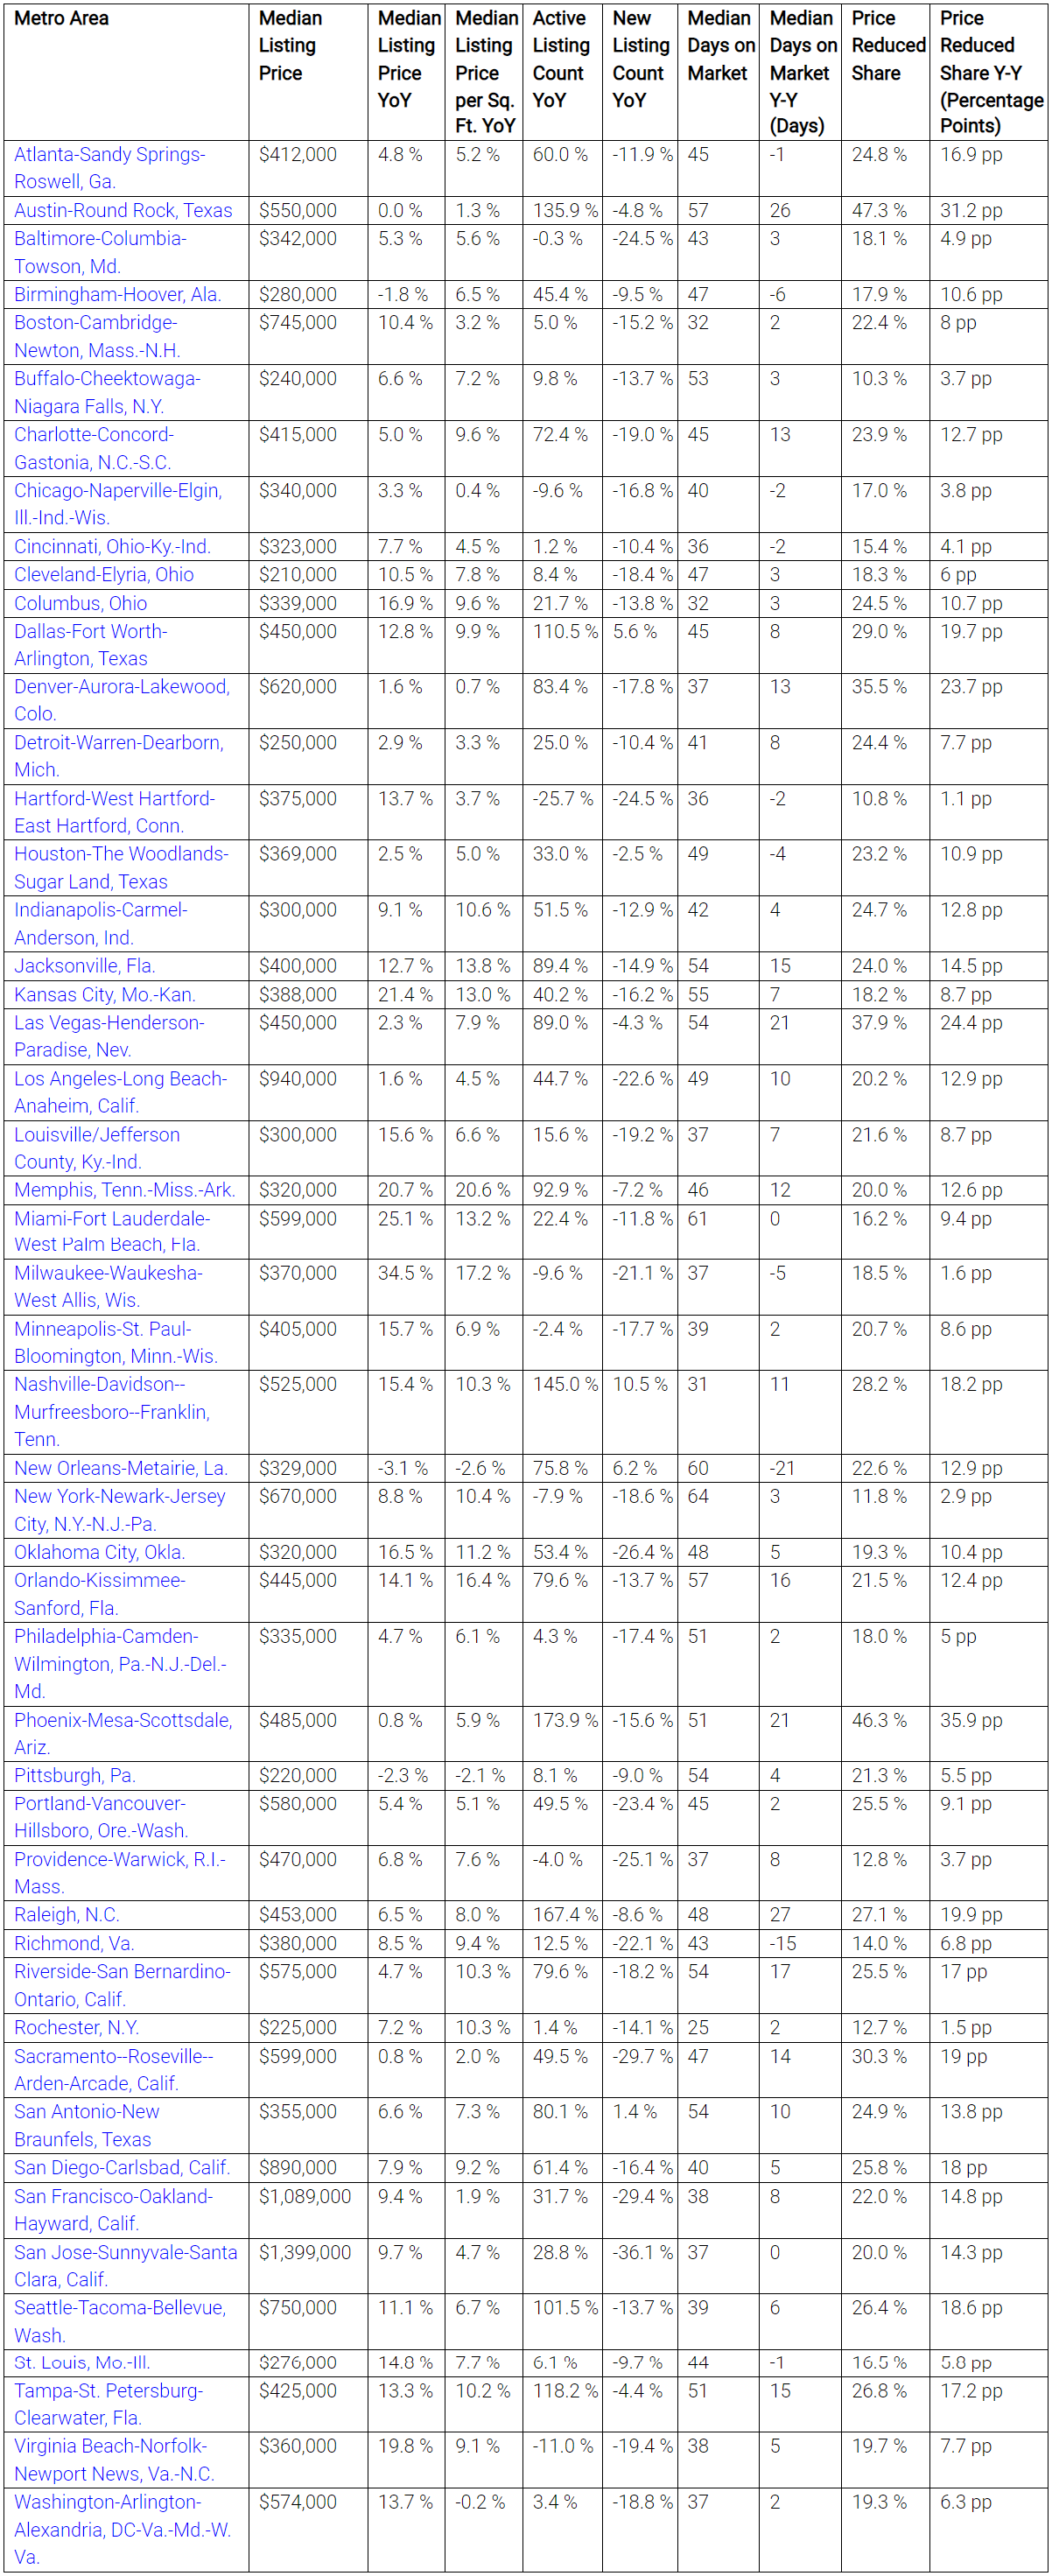
- Among the 50 largest U.S. metros, 42 markets posted yearly active inventory gains in October, led by Phoenix (+173.9%), Raleigh, N.C. (+167.4%) and Nashville, Tenn. (+145.0%). The number of for-sale homes was still down year-over-year in the remaining eight markets, by the largest amounts in Hartford, Conn. (-25.7%), Virginia Beach, Va. (-11.0%) Milwaukee (-9.6%) and Chicago (-9.6%).
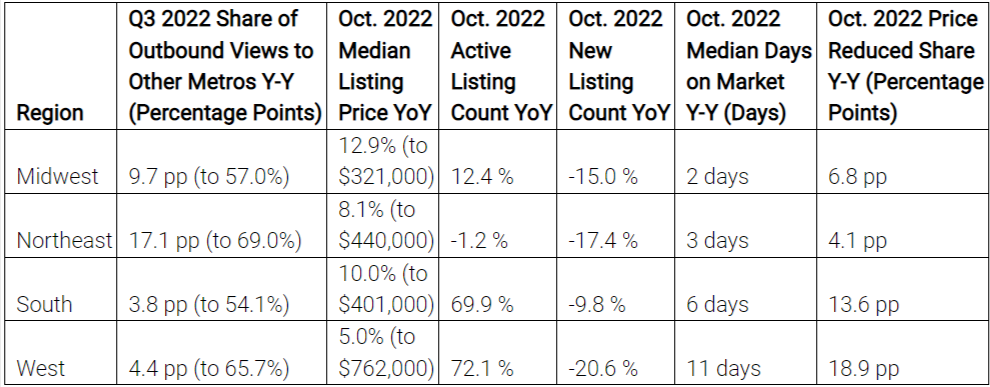
- On average across the 50 largest metros, no regions saw year-over-year new listing increases in October, with the greatest declines registered in the West (-20.6%), followed by the Northeast (-17.4%), Midwest (-15.0%) and South (-9.8%). Furthermore, newly-listed homes increased in just four markets: Nashville, Tenn. (+10.5%), New Orleans (+6.2%), Dallas (+5.6%) and San Antonio (+1.4%).
- Compared to October 2020, active inventory was higher in 32 of the 50 biggest markets, led by western (+33.9%) and southern metros (+7.2%): Phoenix (+132.0%), Austin, Texas (+120.8%), Riverside, Calif. (+67.2%), Memphis, Tenn. (+59.7%) and Nashville (+55.7%). Inventory remained lower than two years ago in the Northeast (-21.1%) and Midwest (-7.9%).
Competition stalls as home listing prices and time on market hold steady
With home sales activity declining along with affordability in October, national trends reflected a market in which competition continued at a cooler pace than during this year's summer peak. However, compared to last month, there was little change in both listing prices and time on market. This may be partly attributed to regional variations in supply and demand dynamics, with still-strong home shopper interest in relatively affordable markets balancing out the slowdown in other areas. In the Midwest and Northeast, where buyers saw relatively smaller inventory improvements in October, time on market and the share of homes with price reductions posted smaller year-over-year increases than in other regions.
- In October, national listing price trends were relatively unchanged from the prior month, with the median listing price dipping just $2,000 to $425,000. Additionally, annual home listing price growth decelerated just slightly, to 13.3% from 13.9% in September.
- On average across the 50 largest U.S. metros, yearly listing price growth entered single-digit territory in October (+9.2%). However, for-sale home prices continued to rise by double-digits year-over-year in 20 markets, led by Milwaukee (+34.5%), Miami (+25.1%) and Kansas City (+21.4%).
- The share of homes with price reductions was up 10.3 percentage points to 20.9% in October, well above 2017 (18.1%) and 2019 (17.0%) levels, but just under the 2018 share (21.2%). Western (+18.9 percentage points) and southern metros (+13.6 percentage points) posted the greatest increases in the share of price reductions: Phoenix (+35.9 percentage points), Austin (+31.2 percentage points) and Las Vegas (+24.4 percentage points).
- The typical home spent 51 days on the market in October, six days more than last year, but still 20 days faster than the typical 2017-2019 pace. The metros where homes spent longest on the market compared to October 2021 were Raleigh (+27 days), Austin (+26 days), Phoenix (+21 days) and Las Vegas (+21 days).
- Time on market declined year-over-year in October in 10 of the 50 largest metros, led by New Orleans (-21 days), where last year's pace was impacted by Hurricane Ida, followed by Richmond, Va. (-15 days) and Birmingham, Ala. (-6 days).
Spotlight On: Higher housing costs fuel demand from out-of-town home shoppers
Similar to October's for-sale housing trends, the Realtor.com® Q3 Cross-Market Demand Report also released today highlights regional variations in homebuying activity. With rising rates pushing the typical monthly mortgage payment up 77.1% in October compared to a year ago, some buyers are potentially trying to add room in their budgets by searching further from where they live for lower-priced homes.
Nationwide in Q3 2022, 60.7% of listings views on Realtor.com® came from users located outside of the listing's metro, compared to 56.9% during the prior quarter and 52.1% at the same time last year. Regionally, northeastern (69.0%) and western (65.7%) home shoppers were most likely to search out-of-market in Q3. This may be attributed to buyers looking for relative affordability, as October median listing prices were higher across large metros in the Northeast ($440,000) and West ($763,000) than in other regions, on average.
Q3 & October 2022 Housing Metrics – Regional*
*Note: Regional Q3 2022 Cross-Market Demand metrics include all metros across the U.S. 50 States and District of Columbia. Regional October 2022 housing metrics reflect the combined average of the 50 largest U.S. metro areas.
October 2022 Housing Metrics – 50 Largest U.S. Metro Areas
Methodology
Realtor.com® housing data as of October 2022. Listings include the active inventory of existing single-family homes and condos/townhomes/rowhomes/co-ops for the given level of geography; new construction is excluded unless listed via an MLS. Realtor.com® data history goes back to July 2016. 50 largest U.S. metropolitan areas as defined by the Office of Management and Budget (OMB).
Q3 2022 Cross-Market Demand Report: Analyzes views of for-sale listings on Realtor.com®. Share of outbound views (i.e. out-of-metro views, out-of-market views) are quoted as percentage of views originating from home metros or states to other metros or states. Note: The Q3 analysis focuses on domestic views from metro areas only, and thus the percent of out-of-metro views will not match previously-published reports/releases in which international and non-metro views were included.
About Realtor.com®
Realtor.com® is an open real estate marketplace built for everyone. Realtor.com® pioneered the world of digital real estate more than 25 years ago. Today, through its website and mobile apps, Realtor.com® is a trusted guide for consumers, empowering more people to find their way home by breaking down barriers, helping them make the right connections, and creating confidence through expert insights and guidance. For professionals, Realtor.com® is a trusted partner for business growth, offering consumer connections and branding solutions that help them succeed in today's on-demand world. Realtor.com® is operated by News Corp [Nasdaq: NWS, NWSA] [ASX: NWS, NWSLV] subsidiary Move, Inc. For more information, visit Realtor.com.