
RETECHNOLOGY PREMIUM MARKETPLACE RELATED PRODUCTS | WEBINARS | SPECIAL OFFERS


You are viewing our site as a Broker, Switch Your View:
Agent | Broker Reset Filters to Default Back to ListU.S. Home Values Continued Fall in October; Rate of Decline Stabilizes
December 17 2011
We pulled this article from the Zillow Research blog.
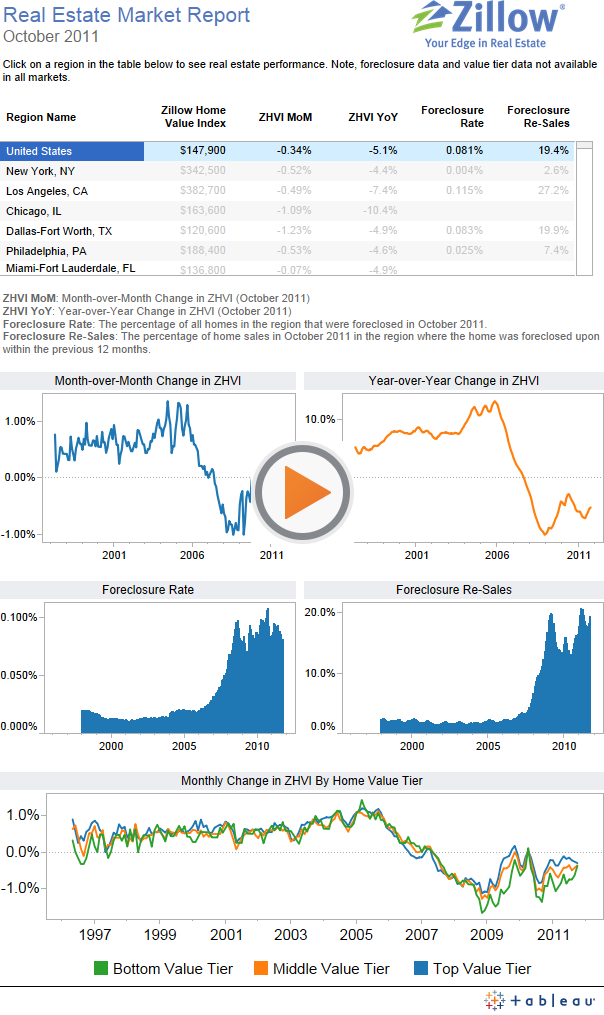
The Zillow Real Estate Market Reports, released today, show home values dipped 0.3 percent from September levels (Figure 1) to $147,900 (Figure 2), representing a 5.1 percent decline on a year-over-year basis. The rate of monthly depreciation has stabilized around -0.2 percent to -0.3 percent over the last few months, an improvement compared to the fall of last year, when rates reached more than 0.8 percent monthly depreciation.
Continued home value depreciation is a reflection of an abundance of housing supply relative to continued anemic demand despite record high housing affordability and historically low mortgage rates. Low consumer confidence and fears of further price declines continue to contribute to a crisis of confidence among potential buyers. We are encouraged by the positive, albeit slow, progress in working down unemployment, as reflected both in the general unemployment measure (U-3) and the U-6 measure which we think is a better predictor of household formation rates (Figure 3). The U-6 unemployment measure considers the unemployed seeking full-time employment plus marginally attached workers and those working part-time for economic reasons.
Home Values
The Zillow Real Estate Market Reports cover 156 metropolitan statistical areas of which 95 showed monthly home value depreciation and 39 metros showed monthly home value increases in October. Twenty-two metros remained flat. Encouragingly, Miami (FL) home values were flat on a monthly basis while Phoenix (AZ) and Detroit (MI) both saw positive monthly gains.
Ten metros saw home value appreciation on an annualized basis with seven of those metros also having monthly appreciation: Fort Collins (CO), Honolulu (HI), Madison (WI), Lincoln (NE), Oklahoma City (OK), Fort Myers (FL) and Tulsa (OK).
Of the top thirty metro regions, Atlanta (GA), Las Vegas (NV) and Tampa (FL) had the highest annualized depreciation rates while San Jose (CA), Washington (DC) and Pittsburgh (PA) had the best annualized performance. Pittsburgh was the only metro in the top thirty with a positive annualized change in home values.
Foreclosures
The foreclosure liquidation rate continued to decline with 8.1 out of every 10,000 homes in the country being liquidated in October (Figure 4). For context, just prior to the robo-signing controversy, the foreclosure liquidation rate reached an all-time high of 10.7 out of every 10,000 homes in October 2010.
In the first and second quarters of 2011, we were seeing a decline in the number of homes in foreclosure despite lower liquidation rates (where liquidation marks the end of the foreclosure process), primarily because of lower rates of new foreclosure initiations (Figure 5). In other words, despite a lower exit rate at the bottom of the foreclosure funnel, fewer homes were being added to the top of the funnel, resulting in fewer homes in the funnel overall. The lower rate of new foreclosure initiations is presumably reflected in more homes remaining in 90+ days delinquency status than would have otherwise been the case. Overall, the percent of loans in 90+ days delinquency status has fallen but at a slower pace than would have occurred had more of these homes entered into foreclosure status (Figure 5).
In the third quarter, we saw an increase in the rate of foreclosure starts compounded by further declines in the rate of liquidation. As a result, there was little change in the cumulative number of homes in foreclosure status in contrast to falling levels in previous quarters. We do expect an increase in the foreclosure liquidation rate either in conjunction with a settlement between major lenders and servicers and various states’ attorneys general or, alternatively, in the aftermath of the settlement effort falling apart. This will cause the cumulative number of homes in foreclosure status to begin to fall again as these homes become REO, unfortunately putting renewed downward pressure on home values.
Foreclosure re-sales made up 19.4 percent of all sales in October. After foreclosure re-sales took a dip earlier this year, we’ve seen a continual increase in re-sales over the last several months.
Outlook
Nationally, home values have fallen 23.7 percent since their peak in May 2007. We expect homes values to fall another 2-4 percent before reaching a bottom in 2012. Drivers that will continue to impact home values include unemployment, negative equity, and consumer confidence. In general, an equilibrium between housing supply and demand has to be found. The large supply of homes will in part be absorbed by the pool of potential buyers that are currently on the fence and doubled-up in other households. The Census reports that in spring 2011, the number of doubled-up households, where multiple adults live as part of the same household, was 21.8 million, up from 19.7 million four years earlier.
Methodological Note
New to the Zillow Real Estate Market Reports this month, Zillow has substantially increased the coverage of the Zillow Home Value Index (ZHVI) by adding 18 million homes to the index and increasing the number of counties covered from 750 to nearly 3,000. By expanding our footprint, we’re able to provide a more accurate picture of the housing market at both the national and metro level. At a metro level, these changes are relatively minor since most homes within the major metropolitan areas were already covered previously. Nationally, the addition of homes in more rural locations (typically with lower values) results in a lower national ZHVI. The September ZHVI under the old data footprint was $171,500 whereas the September ZHVI in the new data footprint is $148,400. The full historical ZHVI time series for this new data footprint has been re-computed back to 1996 so there is no discontinuity.


View the original article on the Zillow Research blog.