
RETECHNOLOGY PREMIUM MARKETPLACE RELATED PRODUCTS | WEBINARS | SPECIAL OFFERS


You are viewing our site as a Broker, Switch Your View:
Agent | Broker Reset Filters to Default Back to ListDeciphering Forbes' "most expensive" zip codes
October 24 2013
 What constitutes an expensive zip code? Depends who you ask and what you ask them.
In Forbes' 2013 list of America's Most Expensive ZIP Codes, Silicon Valley dominates the list with median home prices of more than $5.4 million. According to the article:
Since our list is based on asking prices rather than closed sales or tax assessments, it may not be completely representative of the communities featured — for example, neighborhoods that have become swanky in the past few decades could contain pockets of longtime residents in more modest homes. Rather, our list is a snapshot of each market's current activity.
"This is a view of everything actively for sale in these markets," explains Michael Simonsen, chief executive of Altos Research. "It's the experience you'll have if you want to buy — or sell — a home today in any of them."
We agree – active listing prices are a great input to understanding the market, and trends in these prices often lead the eventual movement of sold prices in an area. But...they don't by extension seem to reflect the experience in many of these markets.
List price is just one view (the ASK) into the market place and based on our findings, we'd argue its bias increases with absolute price. We can illustrate this by incorporating additional views such as OFFER and SOLD price prices for these zips. It is impossible to avoid data bias – we simply can't evaluate all possible data points simultaneously. And we note bias in our own findings on the next page.
To investigate, we compared Altos' 500 most expensive zip codes from the article to our Home Sales Transactions database for each zip. Using this data, we discovered a strong trend in the discount rate of sale price against list price, finding high value properties are much more likely than others to sell at a steep discount off the asking price and this discount increases as median listing price. Plotting our median sale prices against the values published by Altos, results in the bubble graph below.
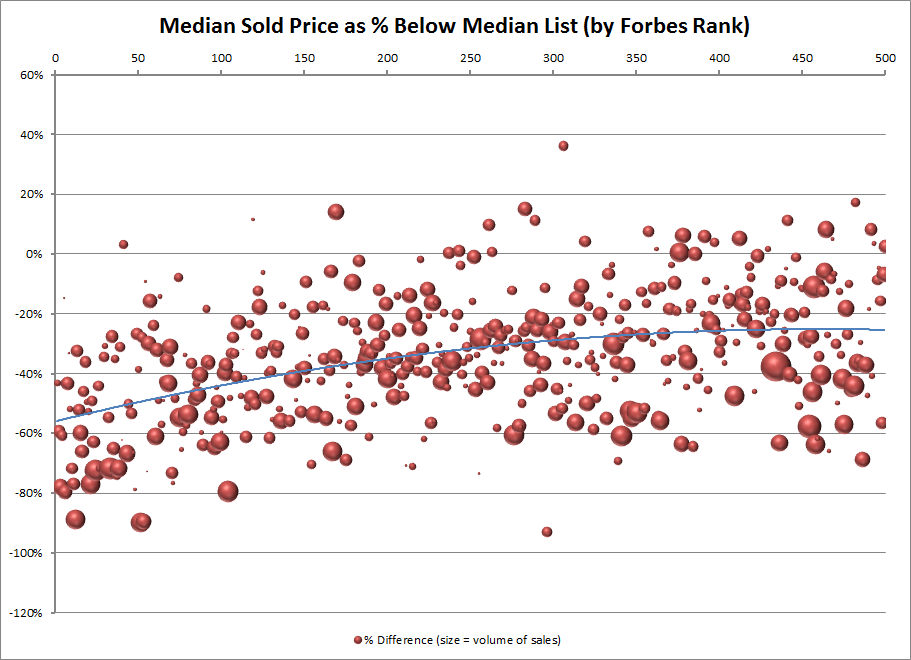
Top Scale: Forbes' ranking across the top (most expensive = 1)
Left Axis: Discount rate (based on median sale vs. median list prices)
Bubble Size: Volume of sold homes evaluated
Higher listing prices generally lead to larger discounts against the selling price, and the higher the prices, the larger the discount – at least based on median value analysis.
- The Top 50 average a nearly 50% discount
- This trend levels off (~25%) once we hit about #350 on the list
So what does this mean?
- Are people really negotiating such steep discounts on properties in these zip codes?
- Or are these pricier homes sitting on the marking (driving the median active list price up)?
- Is the bulk of transaction activity happening at relatively modest end of the price range in these markets?
- Are many sales not making it to the public record?
What bias exists in your own data? Or that report you looked at last week?
Let us know your thoughts in the comments.
A few notes:
- Public records are a lagging indicator: they represent what sold, not what is for sale – however, prices are actual transaction values
- In-non disclosure states such as Texas, prices may be estimated – however the states that dominate this list (CA, NY, FL, etc.) are not non-disclosure states
- Public records lag in availability from a couple weeks to a couple months from data of sale – we would consider the Q2 numbers here to be virtually complete but the Q3 numbers are still in progress of collection in some jurisdictions
- We filtered out multi-unit and non-arms-length transactions
To view the original article, visit the Onboard Informatics blog.