RETECHNOLOGY PREMIUM MARKETPLACE RELATED PRODUCTS | WEBINARS | SPECIAL OFFERS


You are viewing our site as an Agent, Switch Your View:
Agent | Broker Reset Filters to Default Back to List
Due to the ongoing situation with Covid-19, we are offering 3 months free on the agent monthly membership with coupon code: COVID-19A
UNLIMITED ACCESS
With an RE Technology membership you'll be able to view as many articles as you like, from any device that has a valid web browser.
Purchase AccountNOT INTERESTED?
RE Technology lets you freely read 5 pieces of content a Month. If you don't want to purchase an account then you'll be able to read new content again once next month rolls around. In the meantime feel free to continue looking around at what type of content we do publish, you'll be able sign up at any time if you later decide you want to be a member.
Browse the siteARE YOU ALREADY A MEMBER?
Sign into your accountGetting Started With Google Analytics – Part Two
September 10 2014
 In part one of Getting Started with Google Analytics, we talked about what's involved in getting it up and running on your website. Today we will discuss some of the important reports and metrics that it will provide you with. These reports and metrics give you the insight needed to refine or adjust your practices so that your website is meeting your goals and serving its purpose.
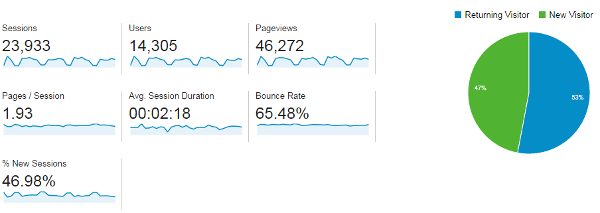
While Google offers customization options for your dashboard, most will include the following metrics: Sessions, Users, Pageviews, Pages/Session, Avg. Session Duration, Bounce Rate and % New Sessions. When looking at these metrics, you can segment and analyze a certain date range to see if any practices you put in place are correlated to a change in the amount of traffic that has reached your website or a change in how users interact with your website.